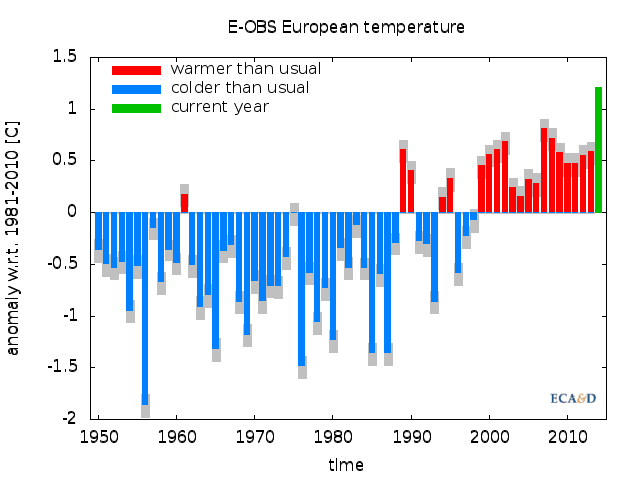
Climate indicator bulletins (CIBs) are regularly produced by KNMI. The activity carries over from the previous FP7 EURO4M project into UERRA. One example is showing the records for 2014 based on the E-OBS gridded observation data set. It is show that the year was the warmest on record over Europe (and this agrees with other climate analyses even though there some may be one or a few tenths of a degree less than the record warmest).
KNMI, with input from DWD, has created a Climate Indicator Bulletin (CIB) issued 16 December 2014, that 2014 was to become he warmest (or almost) the issued warmest year on record in Europe (see: http://cib.knmi.nl/mediawiki/index.php/2014_warmest_year_on_record_in_Europe). These bulletins are generic in the sense that they serve the full range of climate users and applications sectors in Europe within the wider global community. The analyses made use of the E-OBS gridded data set which was updated as part of the UERRA project. The activity to calculate derived climate change indices which are relevant for applications using the E-OBS gridded data set has started..
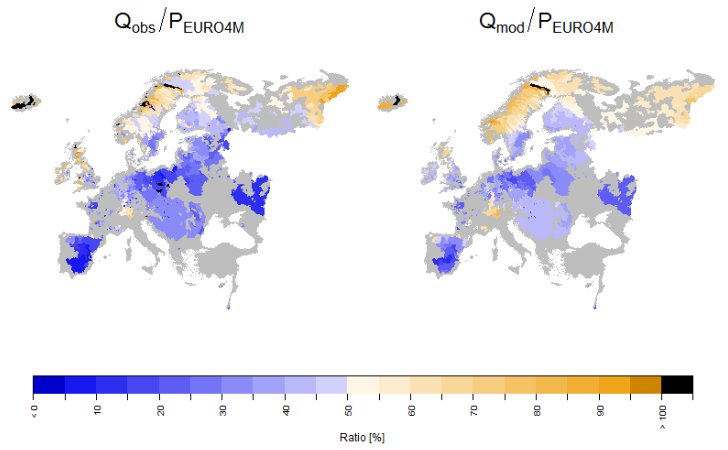
A User-oriented approach to validation of long term means of mainly precipitation (but also temperature to a smaller extent) is to use river basing discharge data to evaluate the model reanalysed values over long term, for example from the EURO4M-HIRLAM reanalysis simulation. The main idea is to make use of observed records of discharge from river catchments across Europe, which in a long term mean can be expected to be balanced by the precipitation falling within the upstream area and the loss through evapotranspiration. The precipitation is given by EURO4M, whereas evapotranspiration can only be estimated. In a first part of the evaluation, the catchment delineation and routing routines of a large-scale hydrological model for Europe, E-HYPE, are used to accumulate the precipitation spatially over a catchment. Then the temporally and spatially aggregated precipitation is compared with observed discharge from the corresponding catchment. An accumulated precipitation less than the discharge (even without considering evapotranspiration) indicates inadequate precipitation. For the second part of the evaluation, simulations with E-HYPE are carried out, and similar analyses are performed as in part one, but using the simulated values of discharge, now including an estimated evapotranspiration.
The hydrological modelling at SMHI had not used the model evapotranspiration and instead used only the temperature input so that is a source of added error.
In this study we explored a novel method of employing a multi-basin hydrological model together with discharge observations to evaluate precipitation data sets. The E-HYPE model framework was applied to distribute precipitation from the WFDEI and EURO4M data sets over the catchments of E-HYPE in order to evaluate the accumulated values in two separate steps. In a first step (i), the accumulated precipitation was compared to observed discharge at the river mouths, and in a second step (ii) E-HYPE simulations were carried out to estimate losses due to evapotranspiration or longer term storage. This was performed for average values for the period 1991-2010.
Both of the analysis steps have distinct uncertainties. The main uncertainty is the amount of loss of water between the precipitation event and the water leaving the catchment as discharge. E-HYPE can estimate evapotranspiration, but little observations are available for evaluation, and the more advanced parameterizations require more uncertain input data, e.g. near surface winds. A simple parameterization purely based on daily average temperature was therefore used in this study; although more advanced schemes can be explored in subsequent studies in UERRA.
Comparing the Q/P-ratios for both observed and modelled discharge revealed some interesting features for different regions. The east-west gradient of differences was highlighted for Scandinavia and the British Isles, where a likely explanation for the gradient is a too deep inland penetration of precipitating systems in the dominant westerly flow. Furthermore, a seasonality issue was observed for the Scandic and Alps mountain ranges. The value of the explored method is in indicating where such issues with the precipitation data are, but subsequent meteorological analyses are necessary to find the exact circumstances of the biases of the atmospheric model.