A comprehensive software package for evaluating reanalyses in several different ways has been further developed. The package has been built at DWD and MET Norway and based and evolved from previous packages in R and HARP from the HIRLAM consoritum. A github repository has been set up where partners can contribute and the software can be shared and it is openly available.
Since the UERRA production of reanalyses has just started (depending on which of the 4 partners you are interested in; there is data from some years from SMHI but not the others), the evaluations and tests have been done on the earlier EURO4M Project reanalyses. 2 years of such data
have been archived in MARS at ECMWF. In addition there are COSMO reanalyses at DWD (Hans Ertel Centre for Weather research) that have been used as input, both to evaluare results and uncertaintis, but also to test the data access and the funtions of the software.
The different reanalyses have been intercompared and compared against observations, both conventional and then independent ones (not used in any reanlysis) from mast data. Below time series against station data are shown for a few different reanalyses (note that EURO4M reanalyses are different from UERRA, in terms of models, methods and resolution. The COSMO HerZ is at high resolution (6 km). The comparisons have started with conventional scores (correlation, bias, RMSE, anomalies, frequency distribution, contingency 4x4 yes/no table for hit rate and false alarm etc.). More have been added like PDF (probability density function) based scores. Recently satellite data have been included in the evealuation and in terms of radiances which are measured and computed from the models in the reanalyses.

Another important way to test the quality is to user high resolution observation based reanalyses done over subregions or nations in Europe. Such ones are over the Alps (Meteo-Swiss) and over the Feno-Scandian domain (MET Norway).
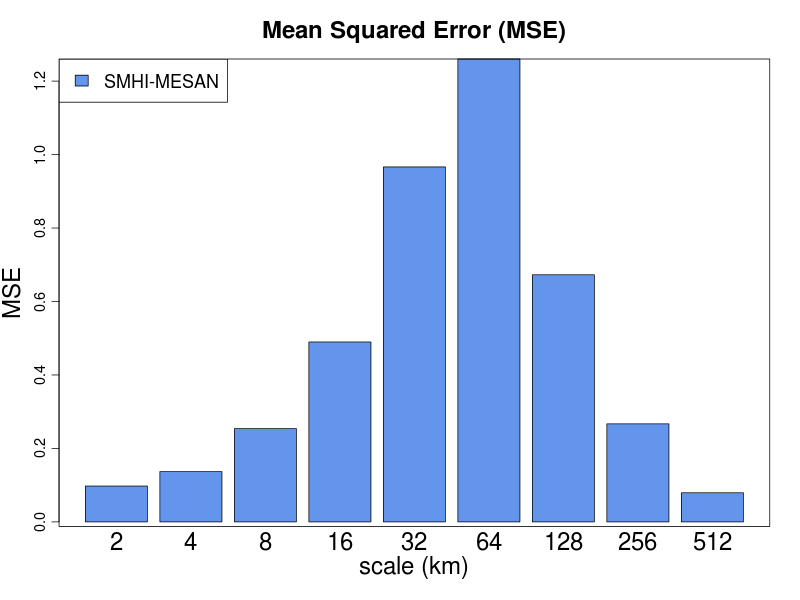
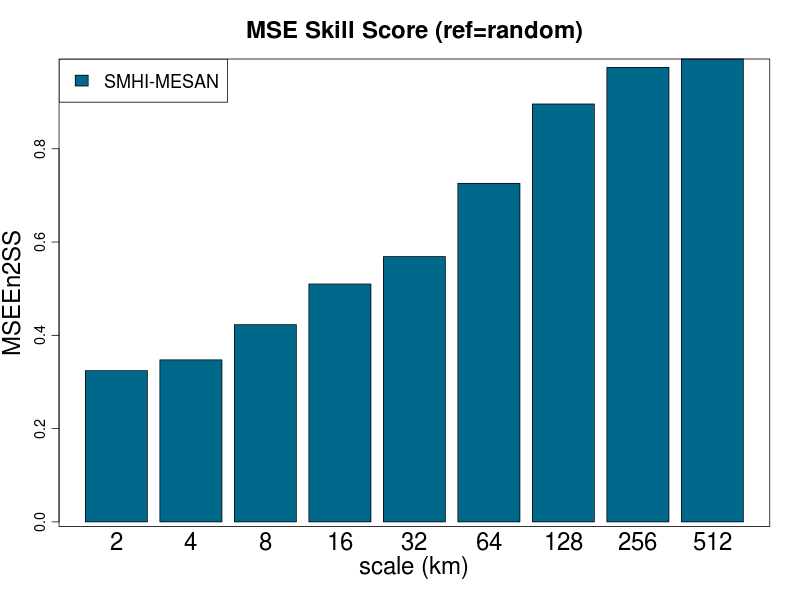
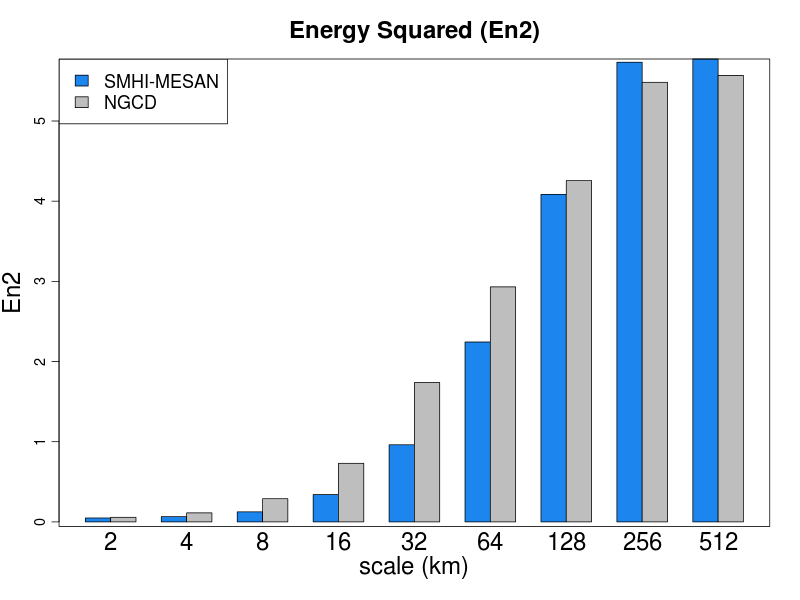
The advantage of the high resolution data is to verify at different scales separately. One can see that is more skill due to higher energy in the larger scales in the SMHI MESAN analysis (a few 100 kilometers). Another method that has been employed is and intensity based technique where one separates according to thresholds and also scales.
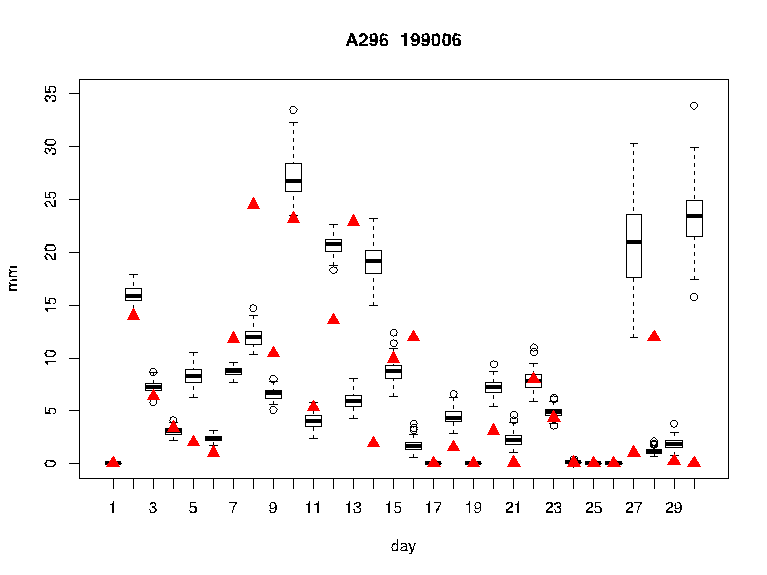
The observation based data sets at KNMI and Meteo-Swiss have now been complemented with probabilistic estimates of interpolation errors and uncertainty bars can be put on the data. An example is shown below where the old HIRLAM EURO4M data are compared with the probabilistic high resolution interpolation. It can be seen that for some days the HIRLAM data are outside or even far outside the range of uncertainty and thus almost certainly in gross error.